

Harnessing AI in Visual Paradigm Online: Generating and Refining Use Case Diagrams
09 Dec
In the fast-paced world of software development and system design, tools that leverage artificial intelligence (AI) are revolutionizing how professionals create visual representations of complex processes. One such innovation is Visual Paradigm Online’s AI tool, which simplifies the generation and refinement of use case diagrams.
This article is inspired by a concise YouTube tutorial (available at https://www.youtube.com/watch?v=rEiveK4PImQ), which demonstrates the tool’s capabilities using a practical example: a booking system for a garage. We’ll expand on the video’s content by breaking down the steps, explaining key concepts in use case modeling, and incorporating additional examples to illustrate real-world applications. Whether you’re a systems analyst, software engineer, or student learning UML (Unified Modeling Language), this guide will help you understand how AI can streamline your diagramming workflow.
Understanding Use Case Diagrams: Key Concepts
Before diving into the tool, it’s essential to grasp the fundamentals of use case diagrams. These are a core component of UML, used to model the functional requirements of a system from the user’s perspective. They focus on what the system does, rather than how it does it, making them ideal for requirements gathering, stakeholder communication, and high-level design.
Core Elements of a Use Case Diagram
- Actors: Represent users or external systems that interact with the main system. Actors are typically depicted as stick figures or labeled ovals. For instance, in a banking app, actors might include “Customer,” “Bank Teller,” or “ATM Machine.”
- Use Cases: Oval-shaped elements that describe a specific goal or functionality the system provides to an actor. Each use case should be named with a verb-noun phrase, such as “Withdraw Cash” or “Book Appointment.”
- System Boundary: A rectangle that encloses all use cases, defining the scope of the system under design.
- Associations: Lines connecting actors to use cases, indicating interactions.
Advanced Relationships
Use case diagrams become more powerful with relationships that show dependencies:
- Include Relationship: Denoted by a dashed arrow with the label «include», this indicates that one use case (the base) always incorporates another (the included) as a mandatory step. It’s useful for breaking down complex processes into reusable sub-processes. Example: In an e-commerce system, “Place Order” might include “Authenticate User” because logging in is required every time.
- Extend Relationship: Shown as a dashed arrow with the label «extend», this represents optional or conditional behavior that extends a base use case under specific circumstances. It’s ideal for handling variations or exceptions. Example: In the same e-commerce system, “Place Order” could be extended by “Apply Discount Code” if the user enters a promo code.
- Generalization: An arrow indicating inheritance, where a specialized use case inherits behavior from a general one (e.g., “Pay by Credit Card” generalizes from “Make Payment”).
These concepts ensure diagrams are modular, reusable, and scalable. Without AI tools like Visual Paradigm’s, creating them manually can be time-consuming, especially for large systems. AI accelerates this by analyzing textual descriptions and generating initial drafts, which can then be refined.
Step-by-Step Guide to Using Visual Paradigm Online’s AI Tool
The YouTube video provides a straightforward walkthrough of the tool, clocking in at just over a minute. It assumes you have a Visual Paradigm Online workspace set up (free accounts are available for basic use). Here’s a detailed breakdown of the process, enhanced with tips for optimal results.
Step 1: Accessing the AI Tool
- Navigate to your Visual Paradigm Online workspace.
- Click the “Create with AI” button, typically found in the main dashboard or toolbar.
- Search for or select the “Use Case Diagram Refinement Tool” from the available AI options.
- Press “Start Now” to launch the interface.
Tip: If you’re new to Visual Paradigm, explore the free tier first. The platform supports collaborative editing, version control, and integration with tools like Jira or Microsoft Teams.
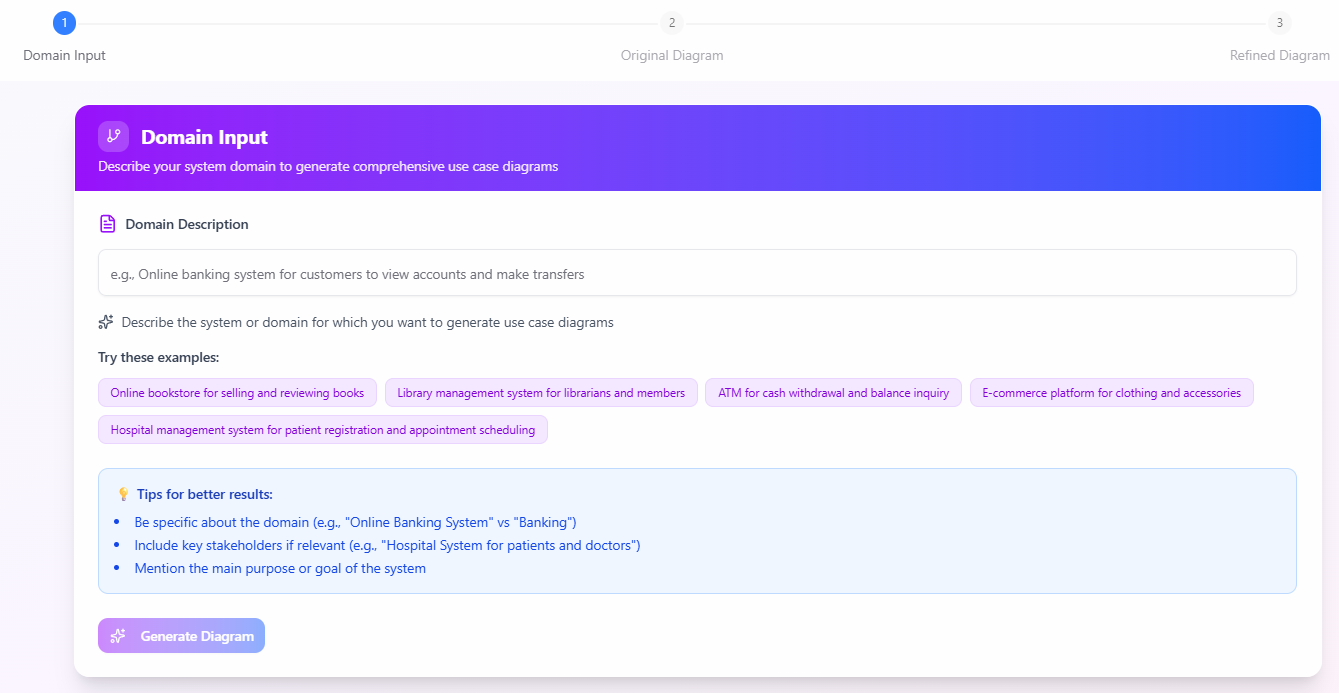
Step 2: Entering the Domain Description and Generating the Diagram
- In the tool’s input field, provide a clear, concise description of the system domain. The video uses “booking system for a garage” as an example. This could include key functionalities like scheduling appointments, managing payments, or handling cancellations.
- Click “Generate Diagram” to let the AI process your input.
The AI analyzes the text to identify actors, use cases, and basic associations, producing a foundational diagram. For the garage booking example, the initial output might include:
- Actors: Customer, Garage Staff.
- Use Cases: “Book Appointment,” “View Availability,” “Confirm Booking.”
- Associations: Connecting Customer to “Book Appointment” and Garage Staff to “Confirm Booking.”
This basic version focuses on core interactions without advanced relationships, serving as a starting point.
Export and Editing Options:
- Export the diagram as an SVG file for high-quality, scalable vector graphics.
- Open the exported file directly in Visual Paradigm Online for manual edits, such as adding notes, adjusting layouts, or incorporating colors.
- Save the diagram to your workspace for easy access and future modifications.
Example Expansion: Suppose your domain is a “hospital patient management system.” Input: “System for registering patients, scheduling doctor visits, and handling medical records.” The AI might generate actors like “Patient,” “Doctor,” and “Administrator,” with use cases such as “Register Patient” and “Schedule Visit.” This saves hours compared to starting from scratch in traditional diagramming software.
Step 3: Refining the Diagram with AI
- Return to the AI tool interface.
- Click “Refine Diagram with AI” to enhance the initial version.
The refinement step introduces sophistication by adding include and extend relationships based on logical inferences from the description. In the video’s garage booking example, the refined diagram might evolve to:
- Base Use Case: “Book Appointment.”
- Include: “Verify Customer Details” (mandatory for every booking).
- Extend: “Cancel Booking” (optional, triggered if the customer changes plans) or “Upgrade Service” (e.g., adding oil change during booking).
This adds depth, making the diagram more representative of real-world scenarios.
Export and Saving:
- Export the refined diagram as SVG and edit in Visual Paradigm Online.
- Save both the original and refined versions separately in your workspace. This versioning allows you to compare iterations or revert changes.
Tip: For best refinements, provide detailed descriptions. If the AI misses nuances (e.g., regulatory requirements in a financial system), iterate by tweaking the input and regenerating.
Real-World Examples and Applications
To illustrate the tool’s versatility, let’s explore examples beyond the video’s garage booking system.
Example 1: E-Learning Platform
- Domain Description: “Online platform for students to enroll in courses, attend virtual classes, and submit assignments.”
- Generated Basic Diagram: Actors: Student, Instructor. Use Cases: “Enroll in Course,” “Attend Class,” “Submit Assignment.”
- Refined Diagram: “Enroll in Course” includes “Pay Tuition” (mandatory). “Attend Class” extends to “Record Session” (optional for review).
This is useful for edtech developers ensuring all user journeys are covered.
Example 2: Inventory Management for Retail
- Domain Description: “System for tracking stock, processing orders, and generating reports in a retail store.”
- Generated Basic Diagram: Actors: Store Manager, Supplier. Use Cases: “Update Inventory,” “Process Order,” “Generate Report.”
- Refined Diagram: “Process Order” includes “Check Stock Availability.” “Update Inventory” extends to “Reorder from Supplier” if stock falls below a threshold.
Such diagrams aid in supply chain optimization, highlighting potential bottlenecks.
Benefits of AI-Driven Diagramming
- Efficiency: Reduces manual effort, allowing focus on analysis rather than drawing.
- Accuracy: AI minimizes errors in identifying relationships, especially for novices.
- Collaboration: Exported SVGs integrate seamlessly with team tools.
- Limitations and Best Practices: AI outputs depend on input quality—vague descriptions yield generic diagrams. Always review and refine manually for domain-specific details. Combine with other UML tools in Visual Paradigm for comprehensive modeling (e.g., sequence diagrams).
Conclusion
Visual Paradigm Online’s AI tool democratizes use case diagramming, making it accessible for beginners while accelerating workflows for experts. As shown in the YouTube tutorial, starting with a simple domain like a garage booking system and refining it with AI can produce professional-grade results in minutes. By incorporating key concepts like actors, use cases, and relationships—and applying them to diverse examples—you can create diagrams that effectively capture system requirements. Experiment with the tool today to see how AI can elevate your design process. For the full visual demo, check out the original video on YouTube. If you’re ready to try it, head to Visual Paradigm Online and start creating!


